

I. Health Resources
1. Total Number of Medical and Health Institutions
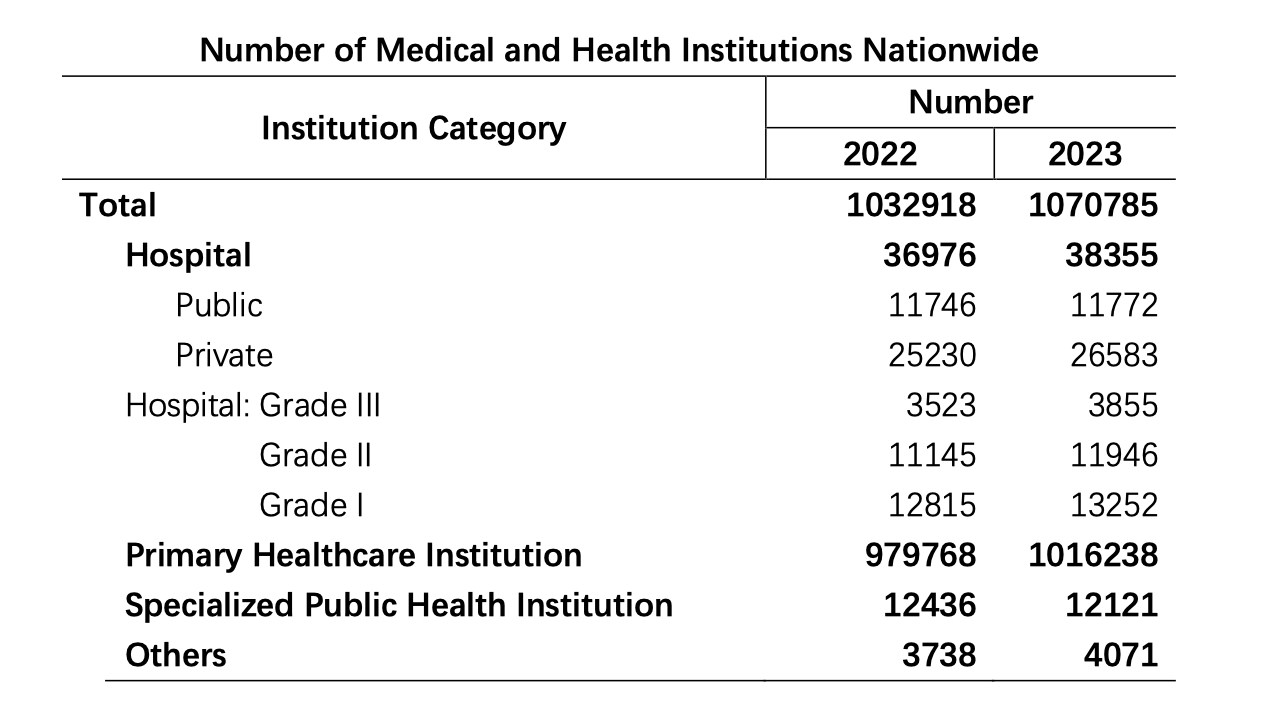
By the end of 2023, the total number of medical and health institutions nationwide reached 1,070,785, an increase of 37,867 compared to the previous year. This includes 38,355 hospitals, 1,016,238 primary healthcare institutions, and 12,121 specialized public health institutions. Compared to the previous year, there was an increase of 1,379 hospitals and 36,470 primary healthcare institutions. Across the country, there were a total of 13 categories of National Medical Centers and regional medical centers specializing in children's healthcare.
Within the category of hospitals, there were 11,772 public hospitals and 26,583 private hospitals. Hospitals were classified into three levels: 3,855 were Grade III hospitals (including 1,795 Grade III-A hospitals), 11,946 were Grade II hospitals, 13,252 were Grade I hospitals, and 9,302 were unclassified hospitals.

2. Total Number of Health Personnel
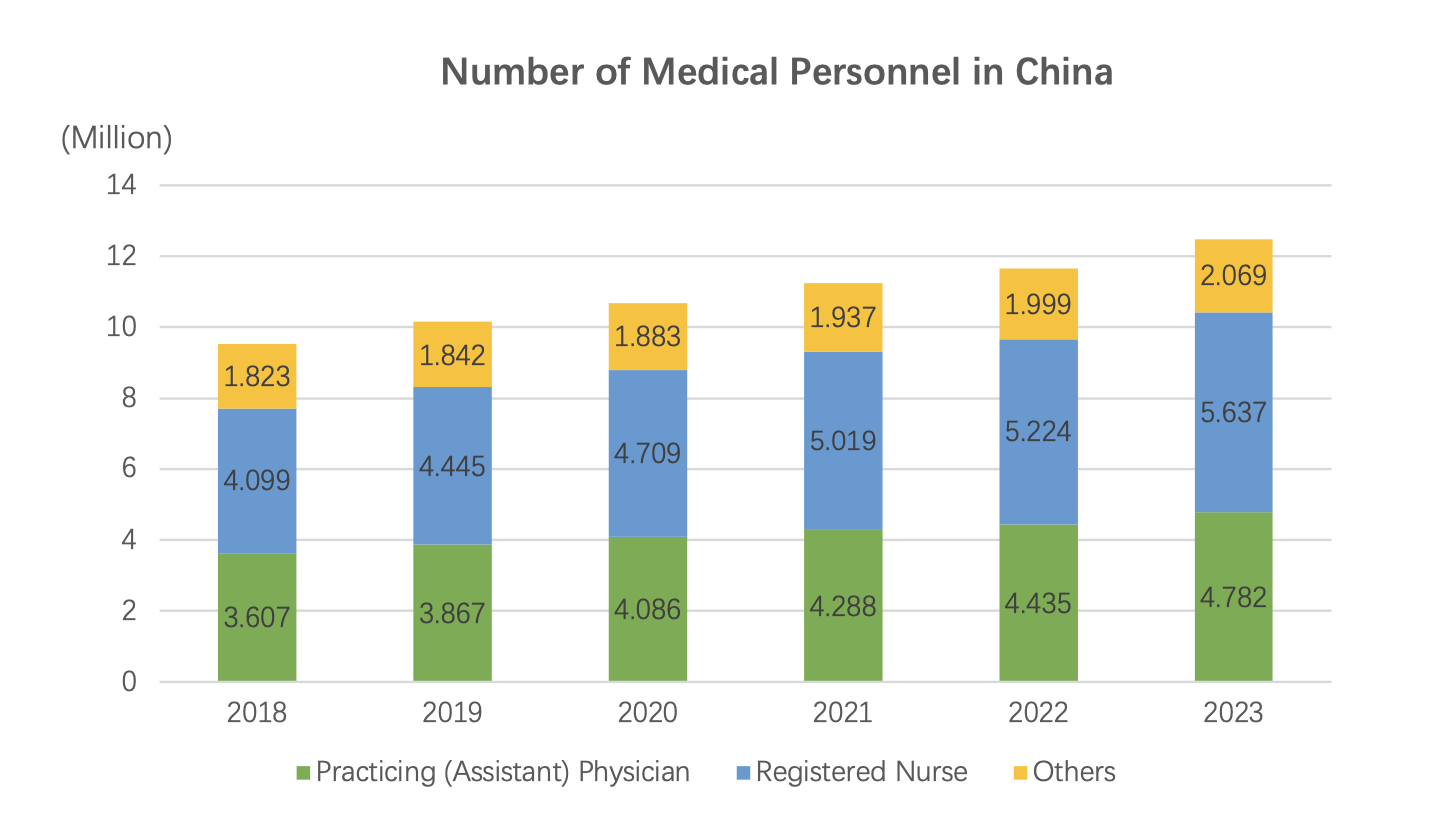
By the end of 2023, the total number of health personnel in the country was 15.24 million, an increase of 827,000 (5.7%) compared to the previous year. Among these health personnel, there were 4.78 million practicing (assistant) physicians and 5.64 million registered nurses. The distribution of health personnel at the end of 2023 was as follows: 9.139 million in hospitals (accounting for 60.0%), 4.953 million in primary healthcare institutions (accounting for 32.5%), and 1.006 million in specialized public health institutions (accounting for 6.6%).

3. Total Health Expenditure
The preliminary estimate of China's total health expenditure in 2023 was 9,057.58 billion yuan, including government health expenditure of 2,414.79 billion yuan (26.7%), social health expenditure of 4,167.68 billion yuan (46.0%), and individual health expenditure of 2,475.11 billion yuan (27.3%). The per capita total health expenditure was 6,425.3 yuan, and health expenditure accounted for 7.2% of GDP.
II. Medical Services
1. Outpatient and Inpatient Volume
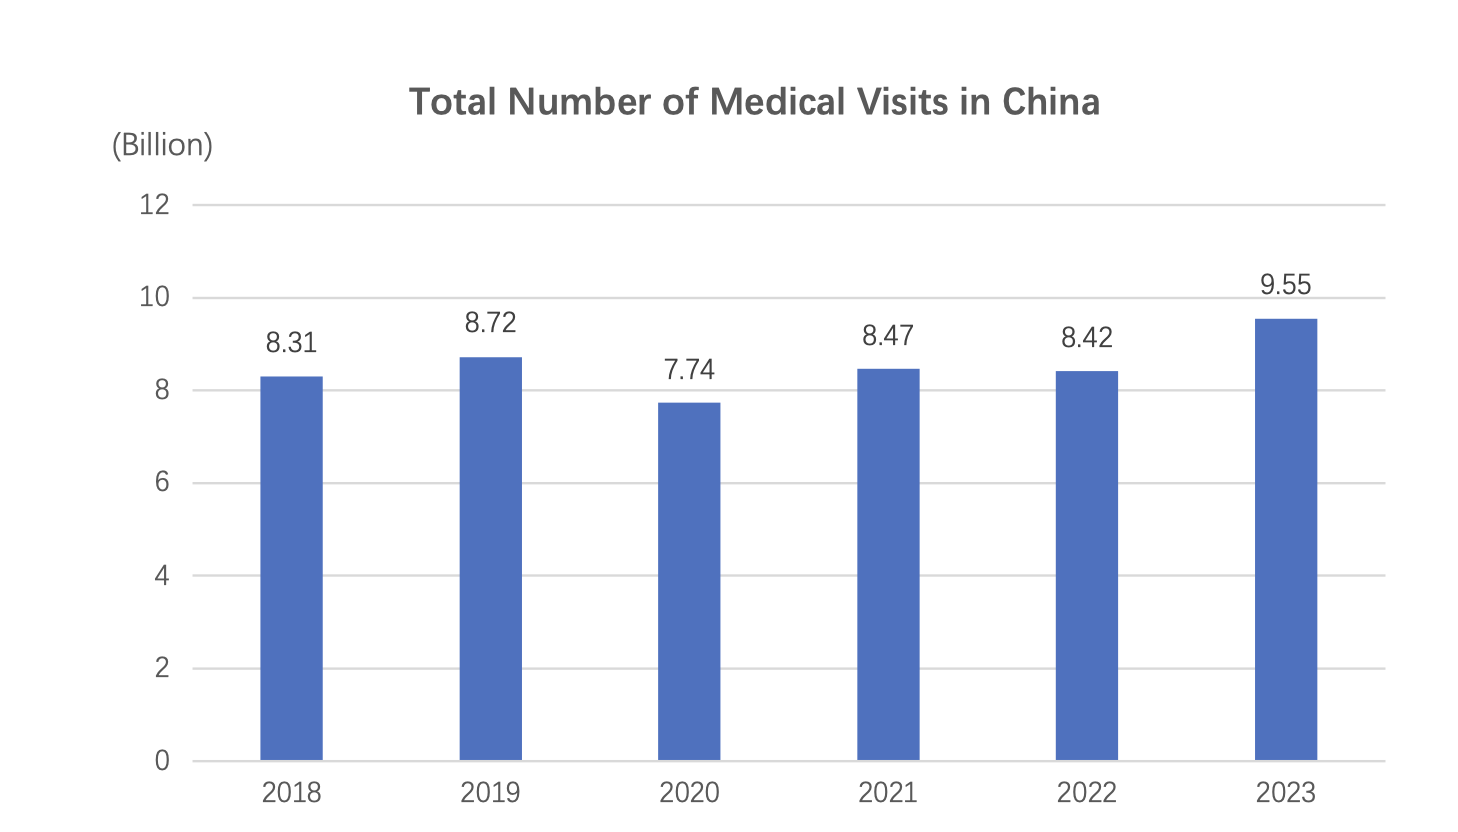
In 2023, the total number of medical visits in China was 9.55 billion, an increase of 1.13 billion (13.5%) compared to the previous year. The average number of visits to medical and healthcare institutions per resident in 2023 was 6.8 times.
Among the total number of medical visits in 2023, hospitals accounted for 4.26 billion visits (44.6%), primary healthcare institutions for 4.94 billion visits (51.8%), and other healthcare institutions for 0.34 billion visits (3.6%). Compared to the previous year, hospital visits increased by 0.44 billion, while visits to primary healthcare institutions increased by 0.68 billion.
In 2023, public hospitals had 3.56 billion medical visits (83.5% of the total hospital visits), and private hospitals had 0.7 billion medical visits (16.5% of the total hospital visits).

In 2023, township health centers and community health service centers (stations) had 3.74 billion medical visits, an increase of 0.42 billion compared to the previous year.
2. Improving Medical Services
As of the end of 2023, 59.2% of public hospitals at the Grade II level and above offered appointment-based medical visits, 90.6% implemented clinical pathway management, 67.6% provided remote medical services, 88.1% participated in mutual recognition of examination results at the same level, and 91.6% provided high-quality nursing services.
3. Blood Supply Assurance
In 2023, the total number of voluntary blood donations reached 16.99 million, with a blood collection volume of 28.92 million units, and a blood donation rate of 12.2 per thousand people.
III. Disease Control and Public Health
Infectious Disease Reporting, Incidence, and Mortality
In 2023, the reported incidence of Class A and Class B infectious diseases (excluding COVID-19) in the country was 2.794 million cases, with 27,000 reported deaths. The top five reported diseases in terms of incidence were viral hepatitis, pulmonary tuberculosis, syphilis, gonorrhea, and brucellosis, accounting for 92.9% of the total reported cases of Class A and Class B infectious diseases. The top five reported diseases in terms of mortality were HIV/AIDS, viral hepatitis, pulmonary tuberculosis, rabies, and syphilis, accounting for 99.8% of the total reported deaths from Class A and Class B infectious diseases.
IV. Maternal and Child Health and Aging
Maternal and Child Health
In 2023, the rate of antenatal care for pregnant women was 98.2%, and the rate of postpartum visits was 97.0%. Compared to the previous year, both the antenatal care rate and postpartum visit rate increased. The inpatient delivery rate in 2023 was 99.95%, achieving virtually all inpatient deliveries. In 2023, the systematic management rate for children under 3 years old reached 94.3%, and the systematic management rate for pregnant women reached 94.5%, both showing improvement compared to the previous year.
National Free Preconception Health Examination Program
Free preconception health examinations are widely conducted in all regions of the country, providing health education, health checks, risk assessments, and counseling for rural couples planning to conceive. In 2023, a total of 8.282 million couples planning to conceive received free examinations, with an average coverage rate of 96.9% for the target population. Those identified as at-risk individuals received targeted counseling and guidance, as well as referrals for treatment, effectively reducing the risk of birth defects through preconception preventive measures.
Promoting Elderly Health Services and Integrated Medical and Care Services
As of the end of 2023, there were 6 national clinical medical research centers for elderly diseases nationwide. There were 6,877 general hospitals with geriatric medicine departments at the Grade II level and above, 11,097 general hospitals and 27,755 primary healthcare institutions that had been transformed into elderly-friendly healthcare institutions. Additionally, there were 87,000 pairs of healthcare and elderly care service institutions that had signed cooperative agreements, and a total of 7,881 healthcare and elderly care integrated institutions had both the necessary licenses for medical practice and elderly care institution records.